My name is Jitendra Tiwari
I'm a passionate developer and love Deep Learning and Machine Learning and Want to apply these novel techniques to solve real-world problems.

A showcase of my projects and my abilities as a Data Analyst well versed in SQL, Python, Tableau, Power BI@jitendra
I'm a passionate developer and love Deep Learning and Machine Learning and Want to apply these novel techniques to solve real-world problems.

Data Exploration of Covid 19 Dataset in Microsoft SQL Server Management.

Flexible Interface to access heterogeneous Digital Twin Data.
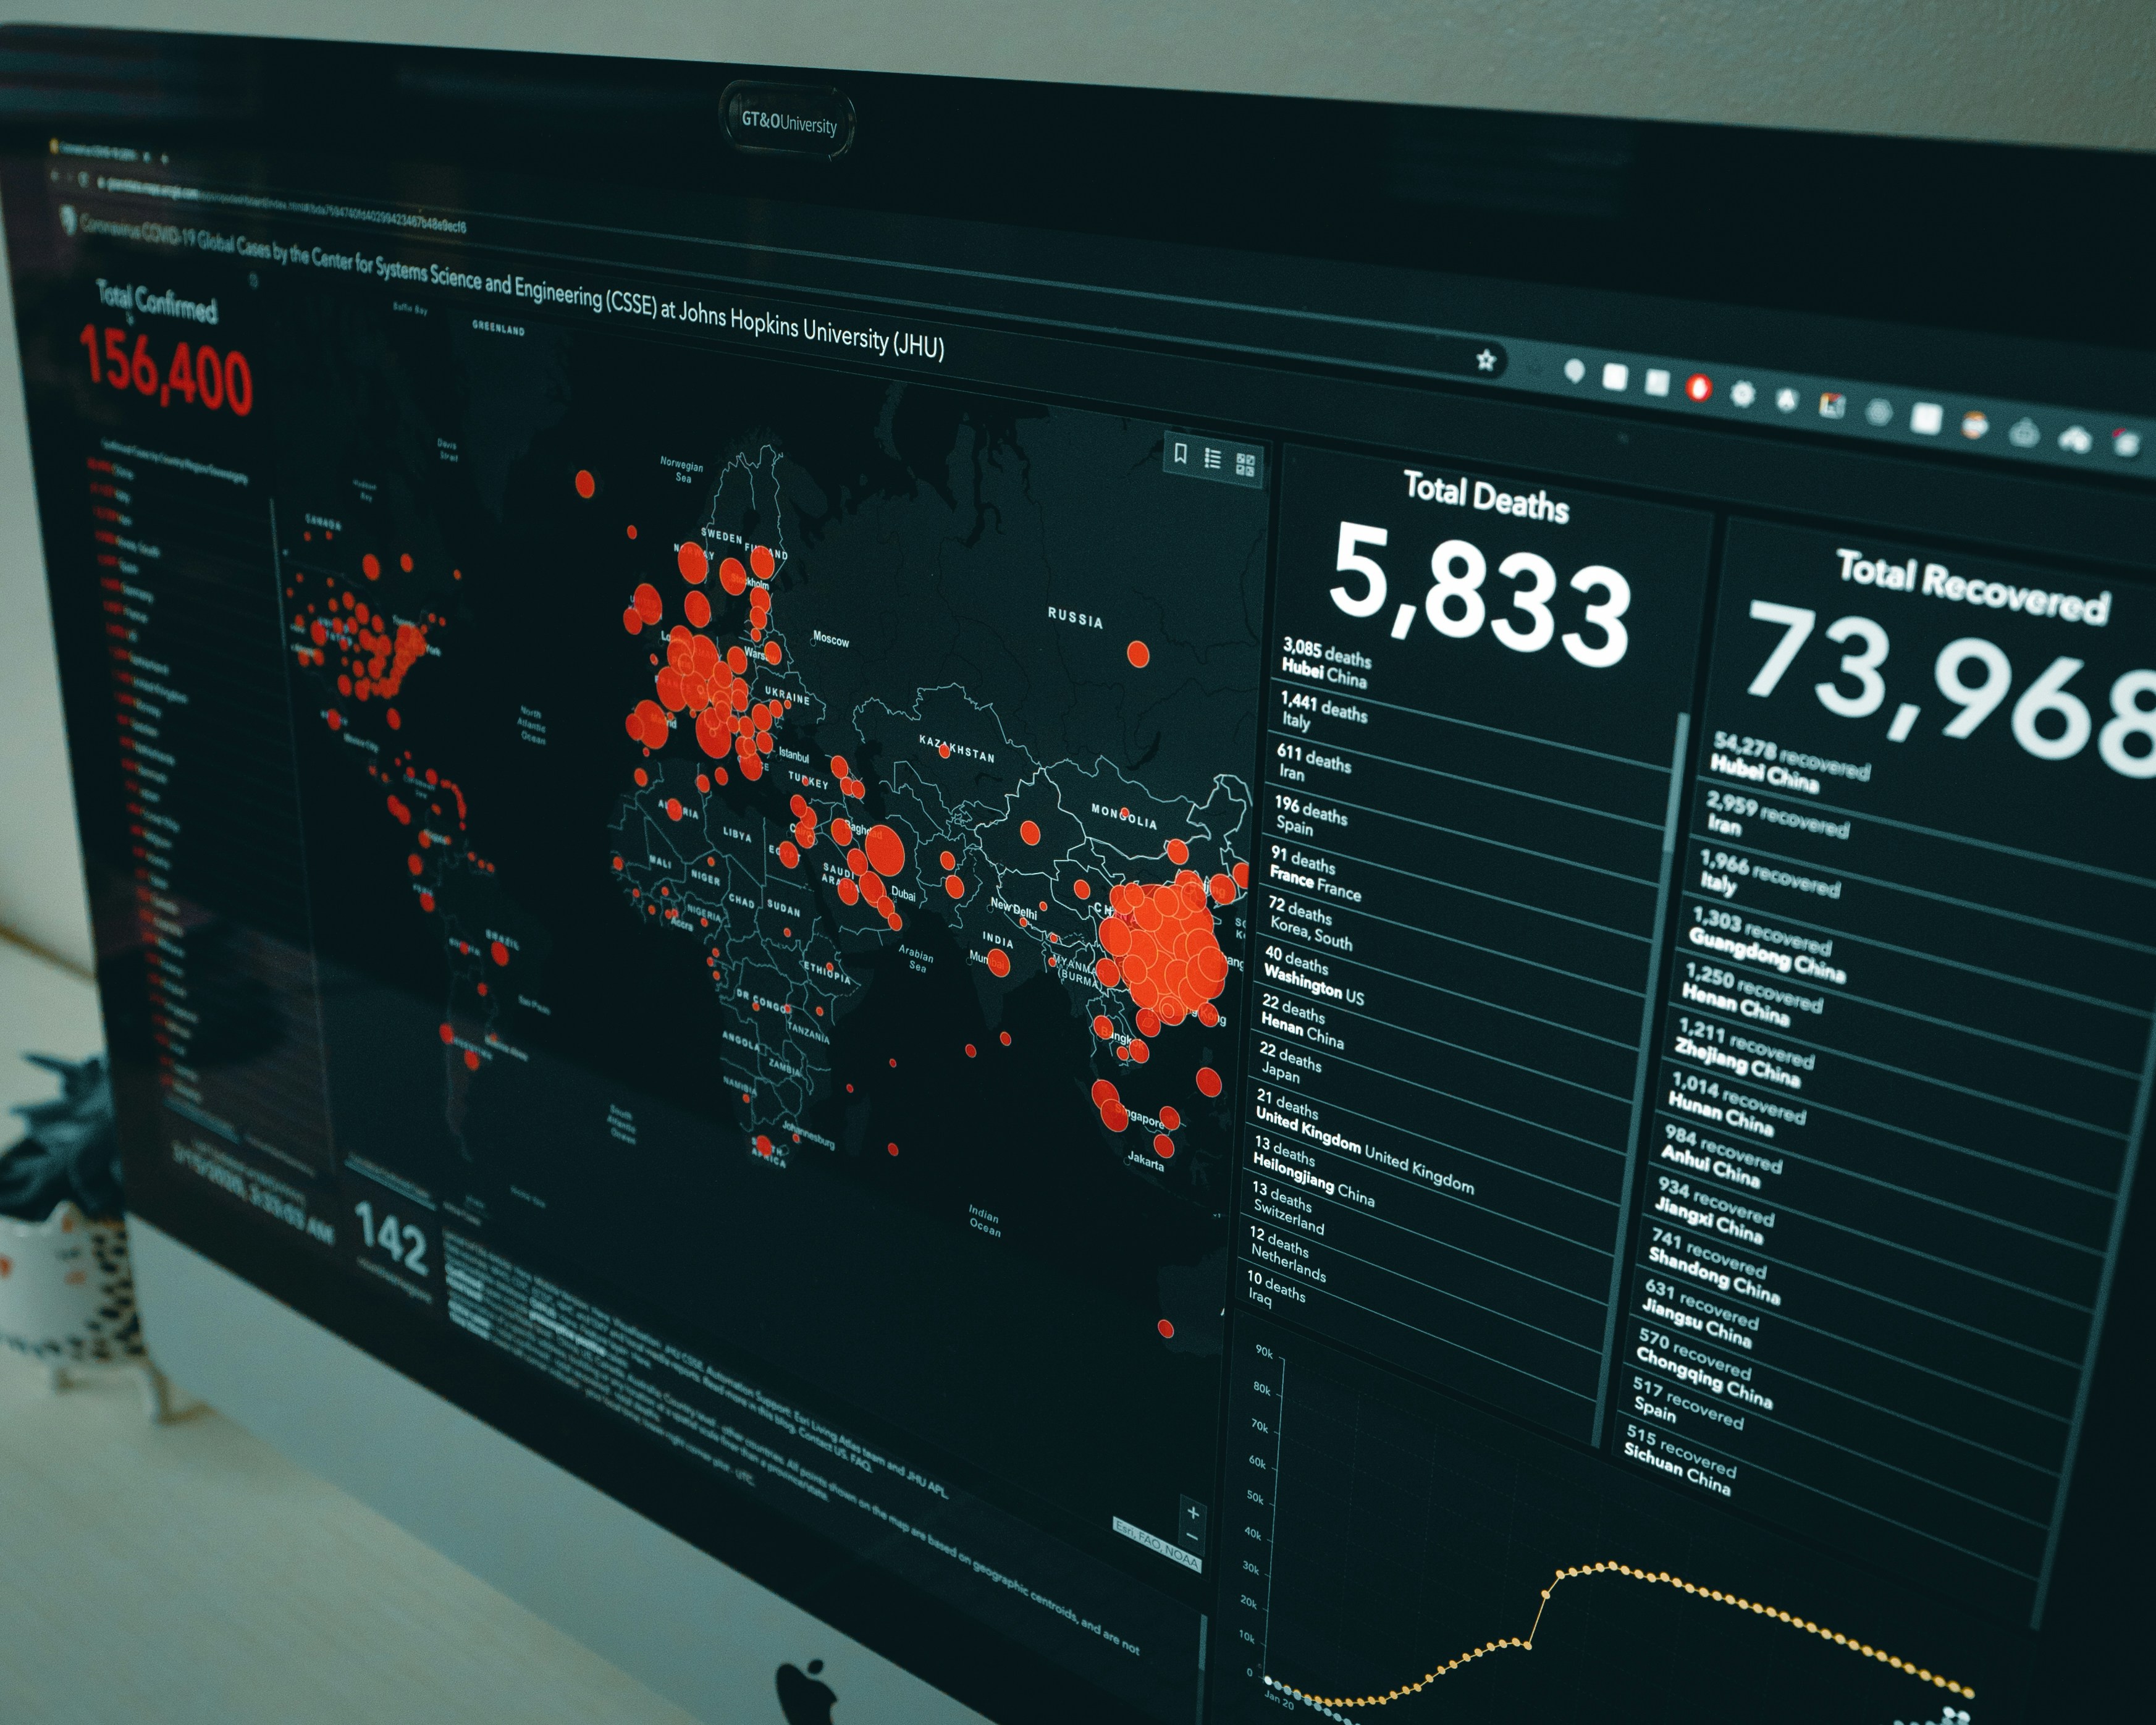
This is the Visualization of Covid data in Tableau. Here one can see the Percent Population infected per country i.e. Percent Population infected in India, United states, China, Mexico, and United Kingdom and the infection forecast for all the five countries , along with the total deaths count at each continent.

In this project, Neural network has been trained for the given data coordinates of half a face and image of the remaining face was mirrored using the trained neural network.
Developed a Recommender Model for Recipes generated by a Large Language Model.

A Dashboard has been prepared by me where Bikes selling have been analyzed for Europe, North america and Pacific. For Visualization purpose i have introduced a slicer that shows us the variation in Bike selling due to martial status and Education of customer.

A Dashboard has been prepared by me where I analyzed data using Power-BI and shows the different plot like job title vs Avg. salary, happiness vs salary, and difficulty to break into data science field. .
Data of the List of largest companies in the United States by revenue has been fetched by me via web scrapping from WikiPedia. Similarly Data of hockey teams has been fetched by me this is a database of NHL team stats since 1990. BeautifulSoup and requests has been used for web scrapping .
A web scraping API is a modern approach that combines the benefits of both web scraping and APIs. Developers can use this powerful tool to scrape websites through API calls. Web scraping APIs remove web scraping access issues by bypassing all anti-bot solutions.In This project the crypto currency prices by Market cap has been fetched by me via an API call .